Volume
JD says: Price is simply an advertising mechanism for opportunity, Time regulates those opportunities & Volume measures the degree of success of any auction.
11/23/20233 min read
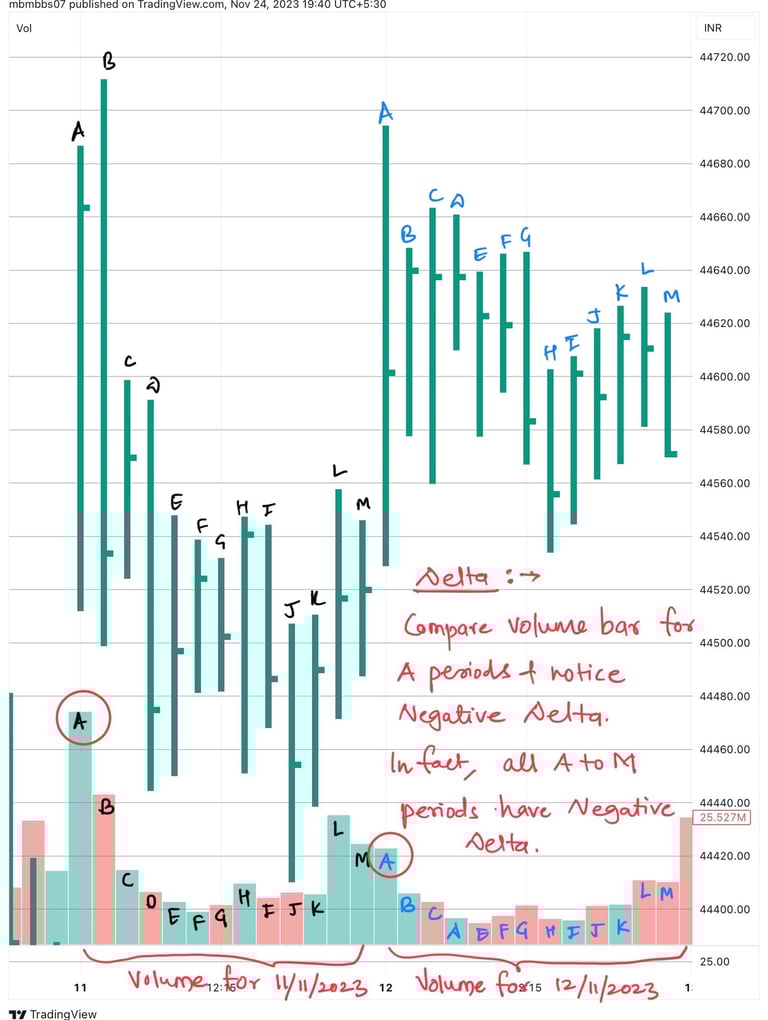
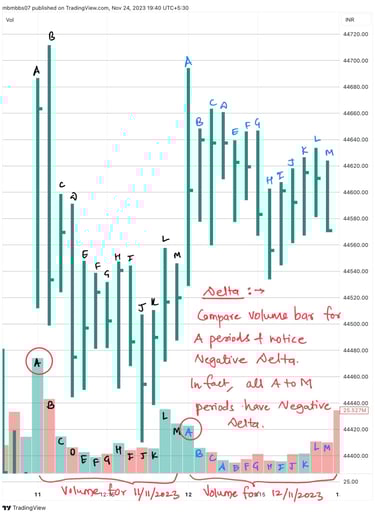
Volume per se is the structural element in stealth mode, since it is not inherent part of the CP graphic; but it’s a very crucial element. Day’s overall volume too is a sign of abundance or scarcity of strong money, hence is a very helpful parameter to judge the day’s performance in facilitation of trades in a given direction. It is the relative volume which has significance, i.e., we keep the track of volume data over last few days on comparative basis. Even volume of each 30 min period is very helpful, & when compared with volume of same period for last day’s market activity, we get the ‘Delta’. We don’t need to quantify delta, all you need is the subjective comparison of volume bars, period by period (as shown in above image). Delta whether negative or positive has implications for monitoring day’s market activity.
Negative delta over majority of periods means poor facilitation in attempted market direction; while positive delta tells us an opposite story. Similarly, day’s total volume is used to monitor the ongoing price trend. There are few market theories about volume, I have studied deeply one of them i.e., Volume Spread Analysis (VSA); but my experience is that volume alone isn't enough to monitor the market activity. The reason being an interesting fact about the volume is that each transaction per piece of an instrument is counted as 1 unit of volume; i.e., when same piece of instrument change hands multiple times in a day, each such transaction is taken as separate unit of volume. Thus volume alone may not tell the whole story about market forces esp. in terms of kind of inventory being traded. On a non-trend day, DTP dominates the market activity; the majority of volume generated on such day is due to same limited inventory being traded among players, with no new inventory entering or exiting the market. Contrarily, on a trend day, new inventory keep either entering or exiting the market. The point is, volume alone may not be sufficient to reveal forces behind market activity; & precisely here comes the complementary role of market structure.
Now imagine a builder who is building a house, & it requires a certain quantity of steel & cement as an input to make it structurally strong; if the builder don’t use required volume of inputs, what do you expect about the strength of such house? Taking further this same analogy, what if the builder uses even more volumes of material than what is optimum; but fails to build a strong foundation & also to add required number of columns to the house, now what’s your expectation for such house? The point I’m making is that, for monitoring market auctions, both volume & structure matters to us, and not only one of them!
Let me add a brief note on structure, it is common sense that majority of the buildings are small houses, which requires no special inputs from structural engineers & are built using general wisdom & let's call those houses as horizontal structures. When it comes to the structural stability, such horizontal structures per se are not big challenge; rather modern day high-rise buildings or skyscrapers, let's call them vertical structures must be accurate in terms of structural engineering. Similarly, it is trending days which require analysis of the structure & not many of the other day types. It is a trend day which must be analyzed in view of its healthy or unhealthy structure. A healthy trend day may have these signs of healthy structure- good High/Low, not too wide IB, multi-periodic RE, 1TF mode, large VAW, proportionate POC migration etc. When majority of these elements are missing in trend day's chart profile, it is termed as emotional trend day. Another important aspect of structure is shape of day's profile, which could be either symmetrical or asymmetrical. There are other interesting shapes too, such as p, b, q, d, B, or D shapes; each having its own implication.
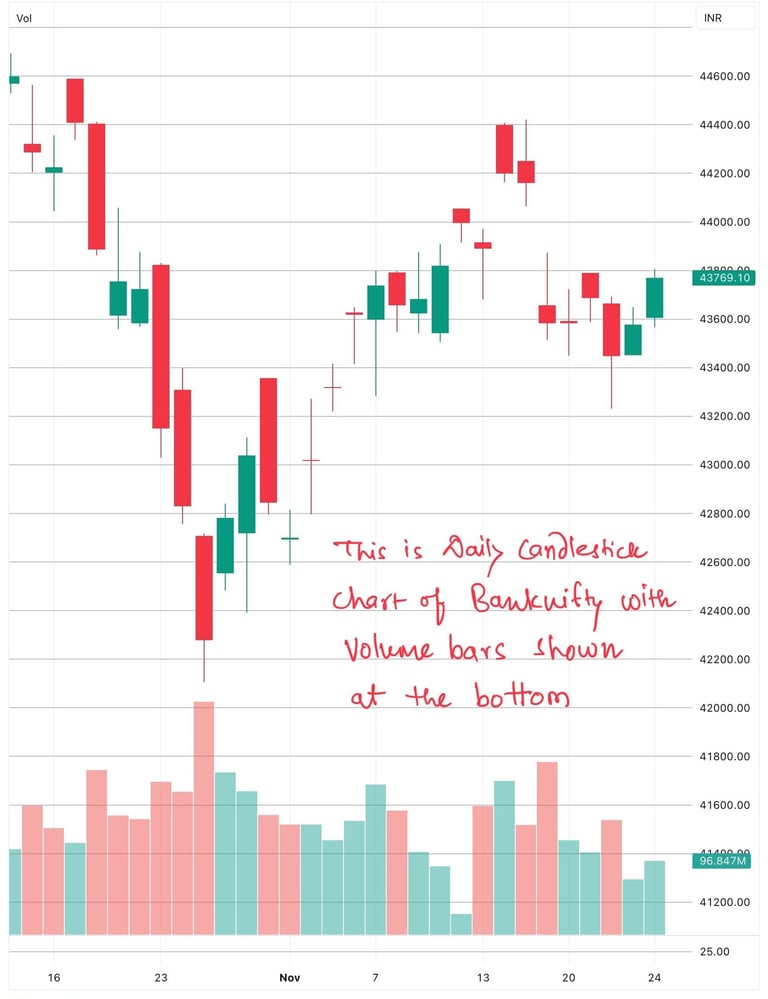
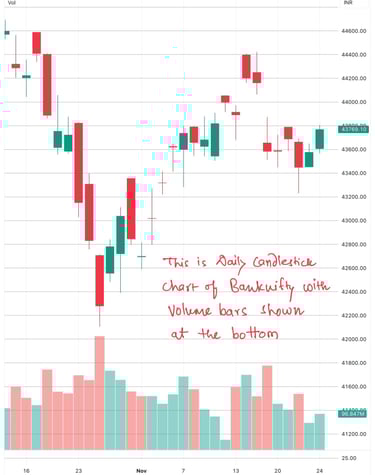
Earlier times, Volume data wasn't available on live basis, & hence VAW was used as a proxy for day's volume. Nowadays, things have changed due to the technological advancements. Volume data for all equities & derivatives are available in all charting software provided by your broker; however, it isn’t available for indices. TradingView has advantage of providing proxy volume data for most traded indices in India, i.e., Nifty 50 & Banknifty, hence my personal preference.