Value Area
It is the focal point of JD's approach to technical analysis.
11/22/20232 min read
Value Area (VA): is the area of chart profile which facilitates 70% of day’s volume i.e., it roughly equals to Mean ±1SD (standard deviation) in Normal distribution curve, and Mean is the fairest price or POC. Do recall your statistics class in the school level Mathematics. It denotes those price levels which majority of market players, irrespective of being DTP or OTP, have agreed to trade with each other. Thus, VA depicts the zone of fair prices for that day.
There are two kinds of VA- 1. Time-VA (T-VA) & 2. Volume-VA (V-VA); but I have noticed that there is no practical difference between them. Time-VA requires either special software or manual calculations as shown in the above image, hence I use only V-VA in the chart profile!
In TradingView, to use V-VA, you can choose ‘Fixed range Volume profile’ from ‘Projection’ tool. It is free of cost tool available there. Beauty of this charting software is as said earlier, it offers proxy volumes for both Nifty 50 & Banknifty also.
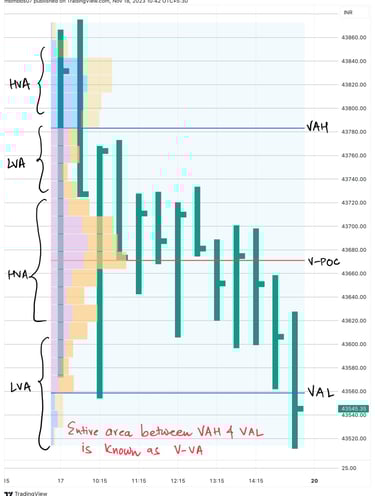
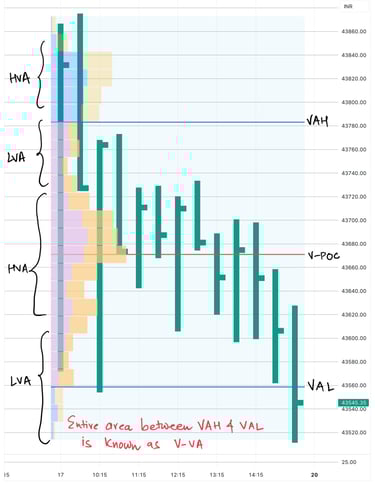
VA has two price levels- VA-High (VAH) & VA-Low (VAL); which act as important reference points. Also note that the part of VA having roughly thickest volume is known as High-Volume area (HVA); and the day’s price range having roughly thin volumes is known as Low Volume Area (LVA). Another parameter to note is VA width (VAW), which simply means range of the VA between VAH & VAL .
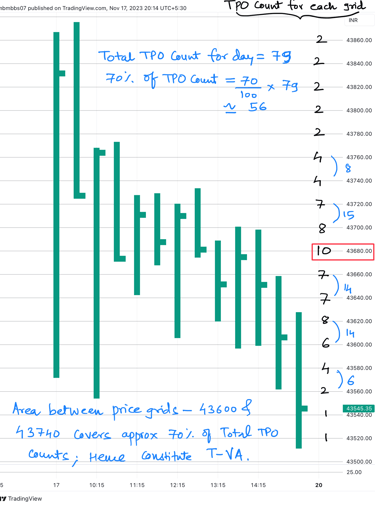
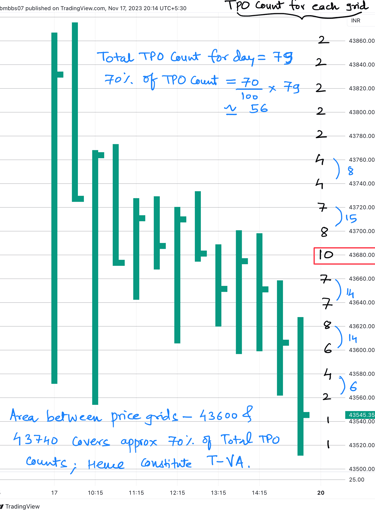
How to calculate T-VA:
First, identify T-POC; later on count the total TPO count, take 70% of this number to establish how many TPOs approximately constitute 70% of the day's volume. Then, examine the two consecutive price grids above & below the T-POC, adding the two with a greater number of TPOs to the T-POC. Continue this process until 70% of the TPOs are included (Look at above image). I advise you to do this exercise of manual calculation of T-VA, & observe for yourself that, there is no much harm in using V-VA instead.