Structural elements of Chart Profile
There are certain things for which we rely on rote learning; being able to read the structural elements of Chart profiles is certainly one of them.
11/19/20232 min read

At the end of the day (EOD), we can analyze Chart profile to decipher what has happened over the day i.e., the composite market activity. To be able to do it we need a consistent approach just like any SOPs; & it starts with knowing the ‘structural elements’ of Chart profile. Just like, for any building, what matters is the structural elements such as-foundation, floors, walls, beams, columns etc.; similarly underlying health of market elements makes the chart profile look either strong, or weak or balanced.
Days market activity in any Chart Profile has following structural elements:
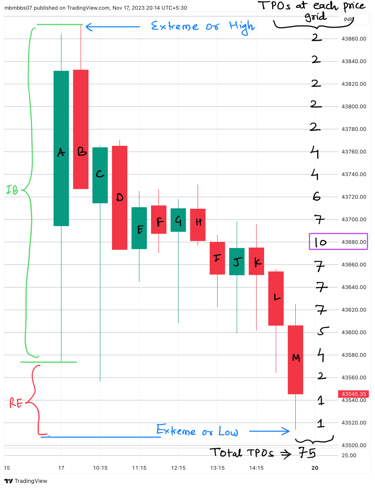
1) Period: It is the price range of each 30 min bar or candlestick & is designated with a letter.
2) Extremes: i.e., High & Low for any Period or whole day.
3) Initial Balance: First hour of market activity forming early range which acts as a base.
4) Range Extension: Market activity that extend day’s range beyond Initial balance. It may not occur on some days.
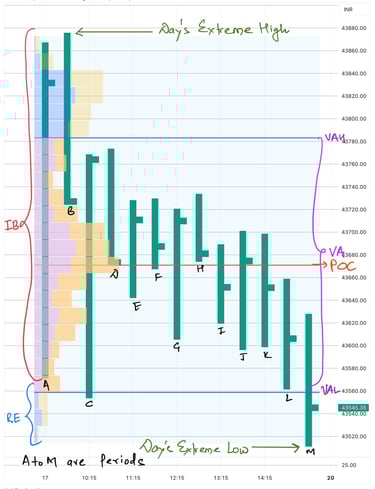
5) Fairest price or Point of Control: It is that price level closest to the center of the day’s range, at which most of the market activity occurred during the day.
6) Value Area: Those price levels which facilitates 70% of days volume.
7) Day type: i.e., type of day’s composite market activity based on EOD Chart profile.
8) Volume: Total amount of trades over whole day’s market activity.
My advice to the readers is that, one must practice creating CPs for their UIC, & be able to depict various structural elements. Through UIC profiling i.e., studying CPs for at least a month of market activity, you will get the feel of your UIC.
Dynamicity & Visualization:
Though, at the EOD, above elements are obvious & static to us; during active trading hours, they are dynamic & evolving or developing in nature. It means these structural elements keep on building at newer price levels as day evolve. So, what we have is “Developing”-High/Low, RE, VA, POC & even day type. However, Initial balance is developing only for first hour, later on it remains fixed for rest of the day.
For any aspiring, hardworking & process-driven Trader; the real intellectual aspect of market is the evolving nature of these elements. With the dynamicity of day’s evolving profile comes the role of visualization & intuition in trading! What if I say that with the right practice, it is possible to visualize early on after market opening, what kind of chart profile & day type may develop on any given day. Just imagine the potential of such visualization skill! Training yourself to be able to visualize in advance how the day’s profile & its elements may likely develop over time will be an exciting area of learning and the key to profit making skill lies there. Does this excite you enough?
Again, I do recommend to the readers, that you must practice creating Chart profiles using your devices & be able to identify the various structural elements; without it, you can't really move ahead with JD's concepts. Now, let’s explore each structural elements in details.