Chart Profile: A novel & creative approach
Power of imagination is a great gift of our right brain; we must use this gift to become a whole brained trader!
11/19/20233 min read
Market Profile vs Chart Profile:
I don’t use any special Market Profile Software available in the market e.g., BellTPO, Amibroker, Ninja trader etc. to create the market graphic. Instead, I use routine bar or candlestick charts and rely on visualization & volume profiles for creating the graphic. The best part is that, it doesn't really matter if you use specialized software or not; since I am not a mechanical Market profile trader, & most importantly, JD's concepts can be used even to my creative graphic too! I do use TradingView software which has free Volume profile tool which even works for Nifty 50 & Banknifty. Since volume data for all equities are available, it works for all equities too. Do note that other indices may not have volume data to use Volume profile; but even here one can use futures volume data as a proxy.
Chart Profile (CP):
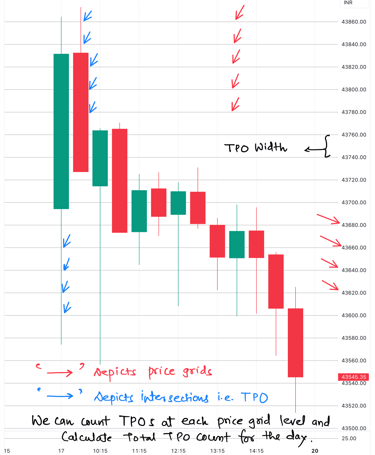
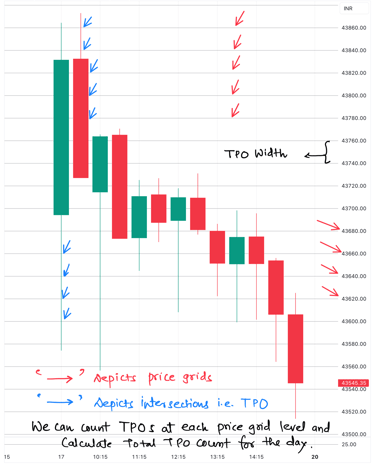
It means 30 min chart of any UIC with height of the bars or candlesticks adjusted in a way so as to emulate Market profile. To create Chart profiles, one must use the height of the device’s screen- desktop or mobile to occupy the whole day’s market activity; and use horizontal grid lines depicting particular price level, so as to form screen adjusted ‘price grids’. The ‘intersections’ of price grids & bar or candlesticks forms proxy version of TPOs for us, which are building blocks of Market profile. (Look at above image for the Chart profile).
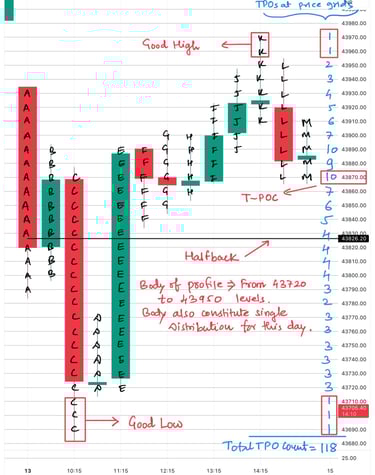
So, these ‘intersections’ for us are the building blocks of Chart profile, hence our TPOs. We can count TPOs at each price grid levels, and can have total TPO count for whole day; this total TPO count can be used to calculate value area (which will be discussed later). The price difference between consecutive screen adjusted price grids become our adjusted height of each TPO, & simply termed as ‘TPO width’.
Though, I use TradingView, I do propose that, any charting tool can be used if horizontal grid lines, volume data (even if proxy data), & fixed range volume profile tool are available in it. Currently many brokers have tied up with TradingView for their charting interface & that’s a bonus. Though, volume profile tool can be used for the shape of day’s profile; however, it still can be imagined using chart profile or can be drawn with the help of excel sheet or simply pen & paper or iPad!
Doesn’t matter much whether it’s bar or candlestick charts; I use 30 min chart for my analysis & there is no perfect reasoning for it; even JD mentions that he had tried different timeframes & found it more relevant for his approach to market understanding. Personally too, my analysis has evolved around 30 min chart. However, there is logical reason for using 30 min chart, i.e., 5/10/15 min charts show ‘too much’ of information in ‘too little’ times, which hampers the recall of market activity; on the other hand, 1 or 4 Hour charts reveals ‘too little’ information over ‘too much’ of times, thus defeats purpose of continuous observation of market auction! Let me be very clear- Don’t use any chart other than 30 min for studying Chart Profiles; else you won’t be able to assimilate my approach to trading. The entire JD’s concepts are built around 30 min market activity over decades, so focus on learning and stay with 30 min charts- you may have never used them earlier or it may seem unnecessary to you, but be it so.